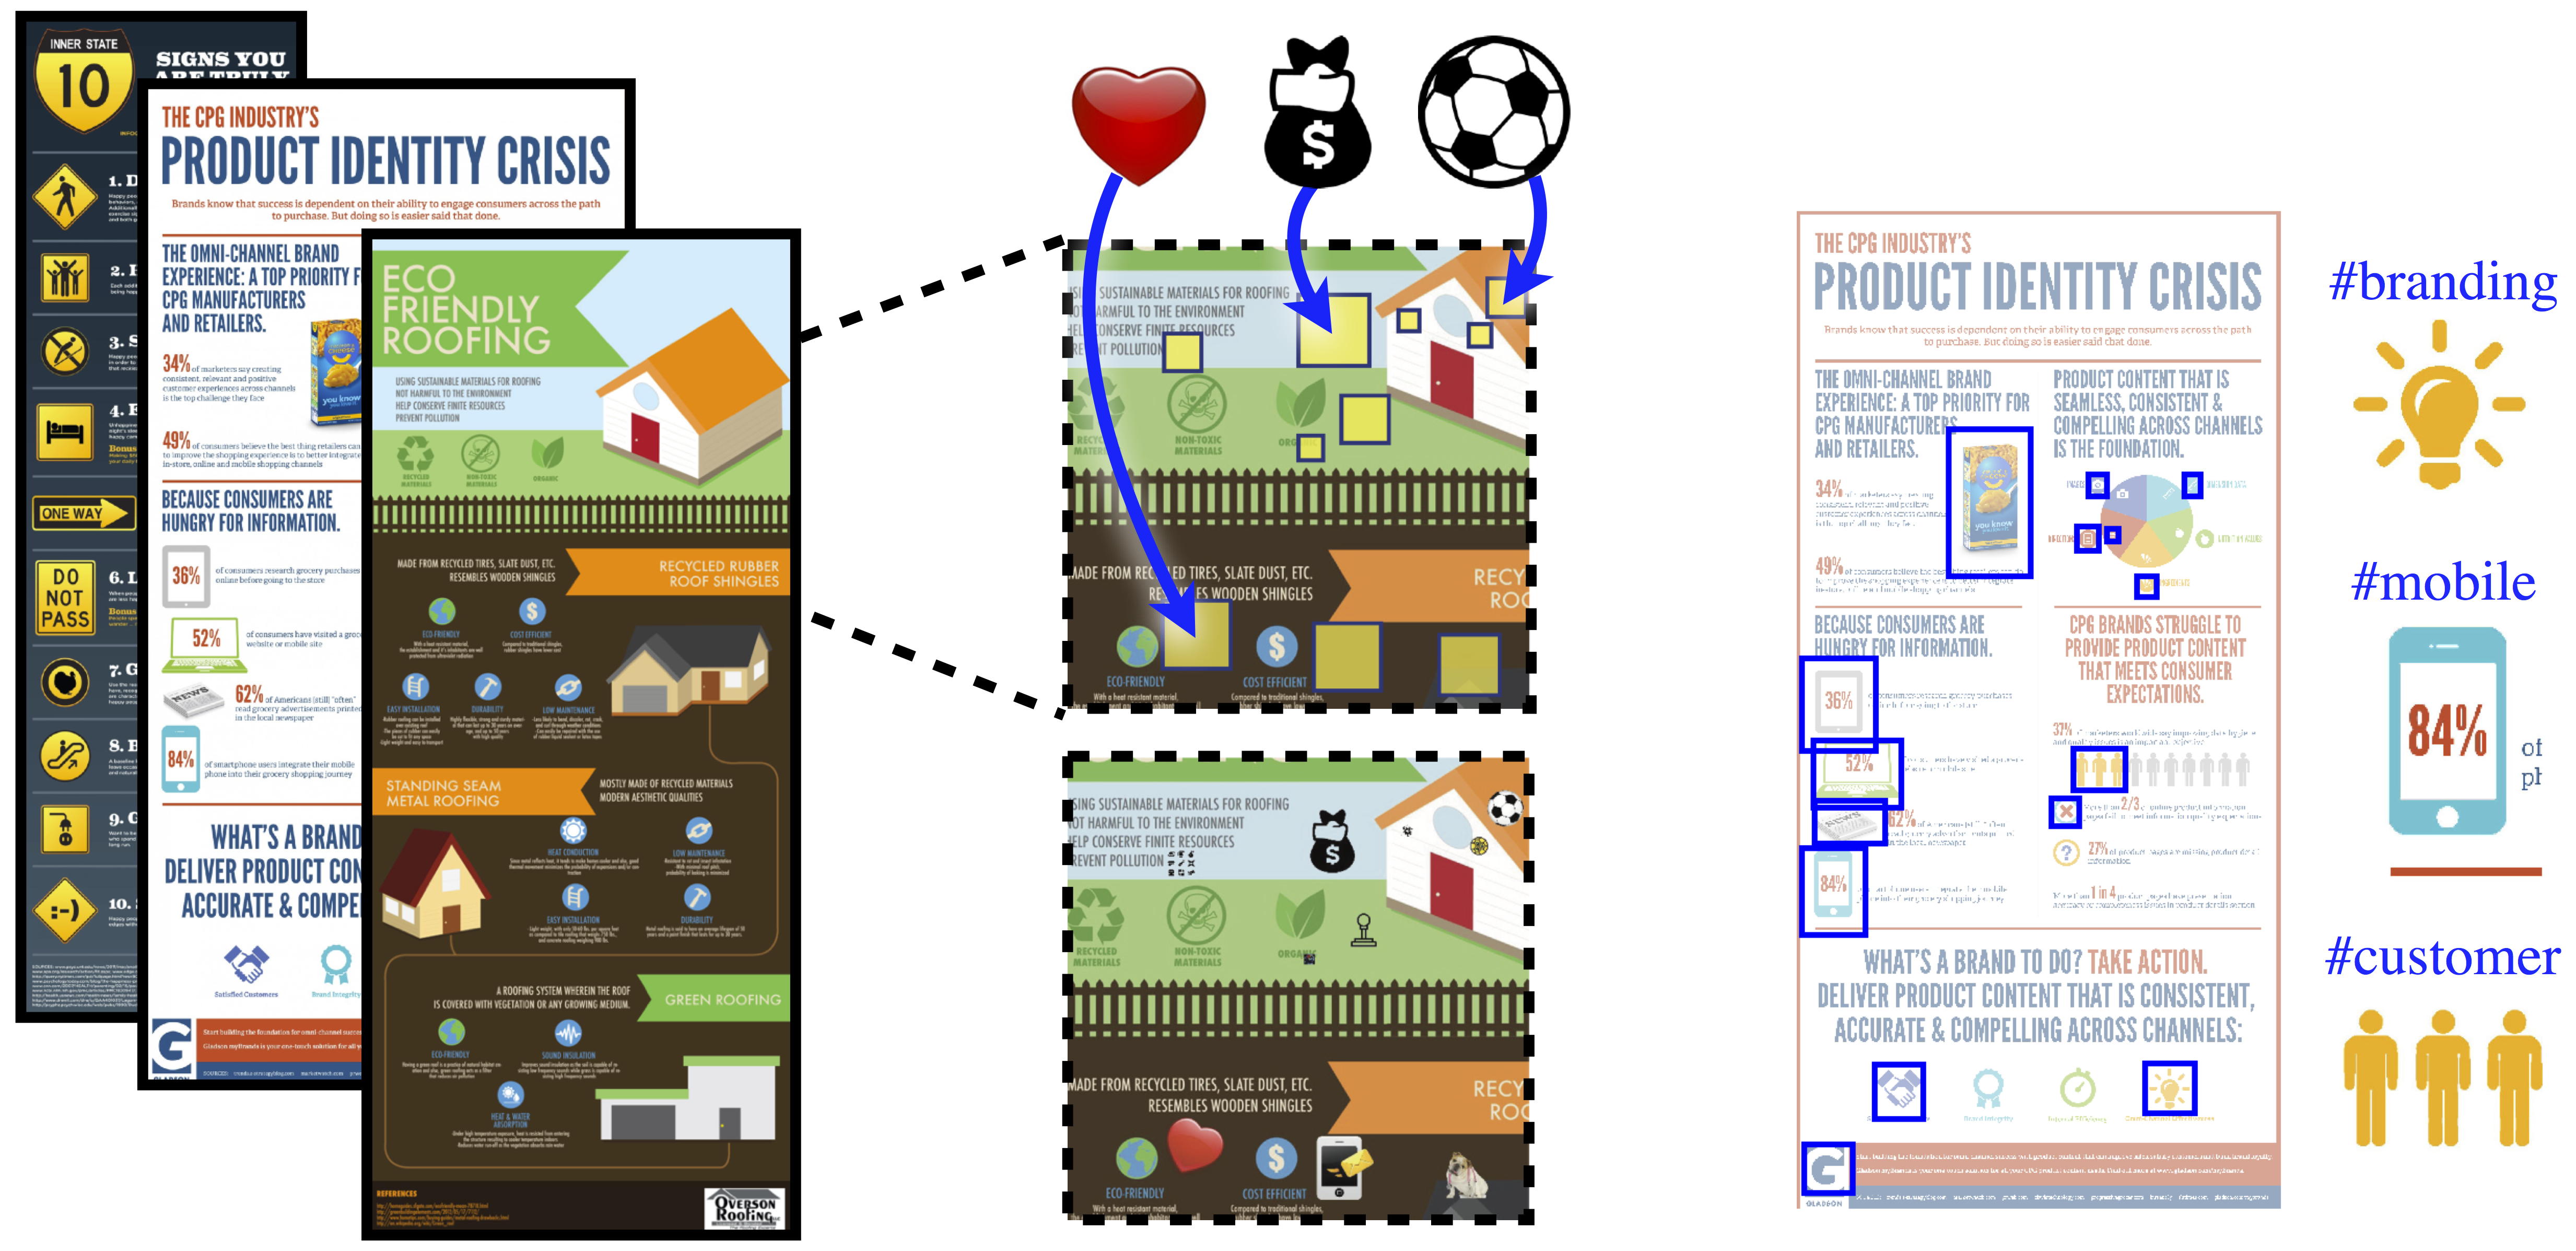
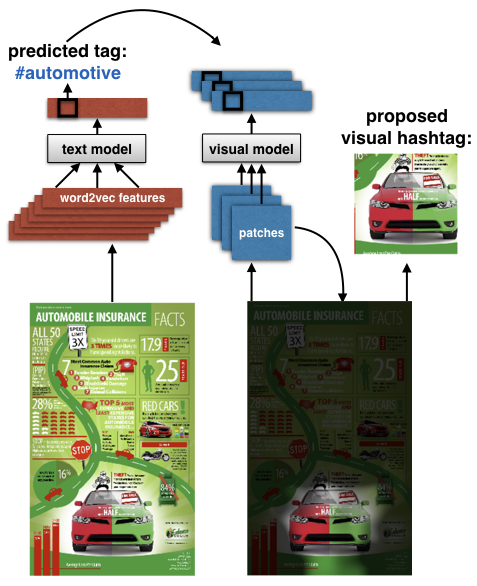
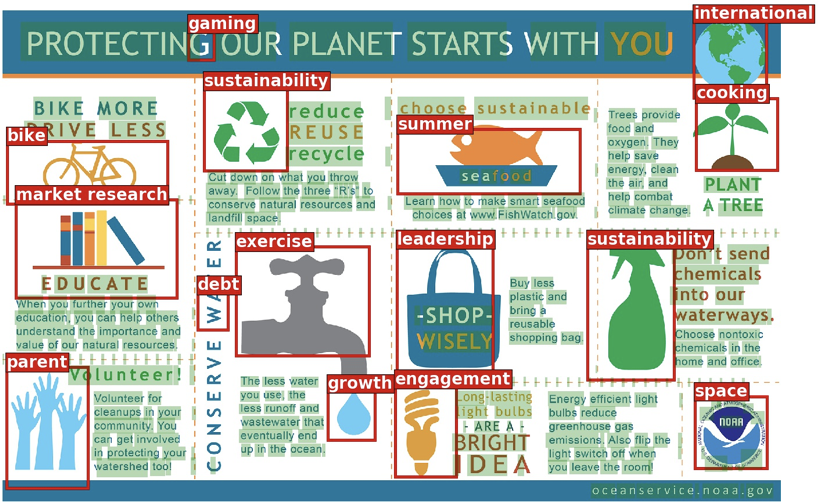
This dataset is provided for research purposes, with annotations that can be used for different computer vision and natural language tasks.

Data & Code

We supply meta-data for 60K infographics as well as a subset of 29K infographics with curated categories and tags, split into training and test sets for prediction tasks. For 1.4K infographics, we additionally provide crowdsourced annotations of icon (visual element) locations for detection applications.

Explore

Explore sample infographics from the dataset along with our automatically-computed text and icon detections. We demo how looking inside the image can provide relevant results for a given search query.

Team

(affiliations at the time when the contributions were made)

Zoya Bylinskii

Zoya Bylinskii

Research Assistant (PhD)
MIT

Spandan Madan

Spandan Madan

Research Assistant (MS)
Harvard

Matt Tancik

Matthew Tancik

Research Assistant (MEng)
MIT

Sami Alsheikh

Sami Alsheikh

Research Assistant (MEng)
MIT

Adrià Recasens

Adrià Recasens

Research Assistant (PhD)
MIT

Kimberli Zhong

Kimberli Zhong

Research Assistant (MEng)
MIT

Hanspeter Pfister

Hanspeter Pfister

Professor
SEAS, Harvard

Frédo Durand

Frédo Durand

Professor
EECS, MIT

Aude Oliva

Aude Oliva

Principal Research Scientist
CSAIL, MIT

Dataset

Metadata and annotations corresponding to thousands of infographics

GitHub logo
Dataset Tags Images per tag Tags per image Aspect ratios
Visually63K 19,469 Mean=7.8, Range=1-3784 Mean=3.7, Range=0-10 1:20 to 22:1
Visually29K 391 Mean=151, Range=50-2331 Mean=2.1, Range=1-9 1:5 to 5:1
MTurk annotation
Visually63K

We provide the URLs for downloading 63,738 infographics from http://visual.ly along with a Python pickle file with meta-data (category labels, tags, titles, # likes, etc.) available for research problems in image recognition and natural language processing.

Visually29K

We curated a subset of 28,973 infographics to cover a fixed set of 391 tags (filtered down from free-form text). There are at least 50 infographic instances for each of 391 different tags. Infographics have an average of 2 tags each (fine-grained topics) and are additionally annotated with 1 of 26 categories (coarse topics). We have split the files into training and test sets for prediction tasks.

Human annotations

For a subset of 1,400 infographics, we collected bounding boxes of all the icons (visual elements) in the infographics. We used these annotations to evaluate our synthetically-trained icon proposal mechanism.


Papers

If you use our data or code, please consider citing


@inproceedings{visually2,
      author = {Spandan Madan*, Zoya Bylinskii*, Matthew Tancik*, Adrià Recasens, Kimberli Zhong, Sami Alsheikh, Hanspeter Pfister, Aude Oliva, Fredo Durand}
      title = {Synthetically Trained Icon Proposals for Parsing and Summarizing Infographics},
      booktitle = {arXiv preprint arXiv:1807.10441},
      url = {https://arxiv.org/pdf/1807.10441},
      year = {2018}
}
							
Main figure from 2018 paper

@inproceedings{visually1,
      author = {Zoya Bylinskii*, Sami Alsheikh*, Spandan Madan*, Adria Recasens*, Kimberli Zhong, Hanspeter Pfister, Fredo Durand, Aude Oliva}
      title = {Understanding infographics through textual and visual tag prediction},
      booktitle = {arXiv preprint arXiv:1709.09215},
      url = {https://arxiv.org/pdf/1709.09215},
      year = {2017}
}
							
Main figure from 2017 paper

Icon Detection

Synthetically Trained Icon Proposals for Parsing and Summarizing Infographics

Augmenting icons

We generate synthetic data by augmenting Internet-scraped icons onto patches of existing infographics to train an icon proposal mechanism. The synthetically trained model successfully localizes icons (visual elements) in real-world infographics.


We provide our dataset of 250K collected icons from the web that we used for our data augmentation as well as a classification task. These icons span 391 different tag classes (the same ones as used for tagging the infographics in our Visually29K dataset).


Dense annotation

Synthetically Trained Icon Proposals for Parsing and Summarizing Infographics

Dense annotation of infographics

Multimodal summarization

Synthetically Trained Icon Proposals for Parsing and Summarizing Infographics

Multimodal summary

We use our automatic icon proposals in combination with icon classification and text extraction to present a novel multimodal summarization application. Given an infographic as input, our application automatically outputs text tags and visual hashtags that are textually and visually representative of the infographic’s topics, respectively.